Artificial Intelligence Dashboards vs Business Intelligence Tools: What’s the Difference?
Summary:
With so much buzz around AI-powered solutions, many business owners are asking: What’s the real difference between an AI dashboard and traditional BI tools?
The rise of artificial intelligence dashboards has transformed how businesses approach data visualization, analytics, and decision-making. At the same time, business intelligence (BI) tools remain the backbone of reporting and data analysis in organizations of all sizes.
This comprehensive guide dives deep into the comparison, offering actionable insights for entrepreneurs and solopreneurs who want to leverage data for growth, efficiency, and innovation.
So, let’s delve into this valuable insight now!
Key Takeaways
- Understanding how AI dashboards differ from traditional BI tools.
- Learning why combining BI and AI creates better business decisions.
- Exploring real-world examples of AI dashboards in business, healthcare, and education.
- Discovering how entrepreneurs can save time and make smarter decisions with AI.
- Knowing the challenges and future trends of AI-powered analytics.
Artificial Intelligence Dashboards vs Business Intelligence Tools?: Know The Difference
An artificial intelligence dashboard is a data visualization interface powered by machine learning and AI models.
It goes beyond traditional BI dashboards by offering predictive analytics, real-time anomaly detection, and even natural language querying (NLQ) so users can ask questions in plain English and get instant answers.
Moreover, these AI dashboards leverage deep learning, neural networks, and cognitive computing to recommend actions, detect trends, and forecast outcomes.
In contrast, business intelligence tools like Tableau, Power BI, and Looker primarily focus on descriptive analytics.
They provide a clear, organized view of past and present data through charts, graphs, and scorecards.
While many BI tools now include some AI features, their primary function is to consolidate, clean, and visualize data for human interpretation.
In short, BI tools answer the question “What happened?” whereas AI dashboards are designed to answer “What’s likely to happen next?” and “What should we do about it?”

Why Entrepreneurs & Solopreneurs Need Artificial Intelligence Dashboards vs Business Intelligence Tools?
Entrepreneurs and solopreneurs face unique challenges: limited manpower, tight budgets, and the constant need for speed.
Artificial intelligence dashboards offer a competitive edge by combining automation, predictive analytics, and intuitive interfaces.
They minimize manual effort, freeing up founders to focus on strategy.
For example, a solopreneur running an e-commerce shop can use an AI dashboard for marketing analytics to instantly see which ad campaigns are delivering ROI and automatically adjust budgets.
A traditional BI tool would still require them to manually set up reports, filter datasets, and interpret trends.
Key Advantages for Entrepreneurs:
- Proactive Decision-Making: AI dashboards highlight anomalies and predict future outcomes, enabling founders to act before problems escalate.
- Accessibility: Natural language queries make data analysis accessible even to those without technical expertise.
- Operational Efficiency: AI can automate reporting cycles, recommend resource allocation, and provide early warnings.
- Growth Insights: Predictive analytics uncover new market opportunities and customer segments.
BI tools are still essential, particularly for compliance, financial planning, and deep-dive historical reporting.
Together, they provide a complete ecosystem, BI for clarity of what happened, and AI dashboards for foresight into what’s coming next.
How Artificial Intelligence Dashboards vs Business Intelligence Tools Work in Business, Healthcare, and Education?
AI dashboards and BI tools work differently but complement each other in key sectors:
Business:
- AI Dashboards: Provide real-time monitoring of sales, inventory, and customer behavior. Predictive models anticipate demand spikes and recommend pricing adjustments.
- BI Tools: Generate historical sales performance reports, customer lifetime value calculations, and P&L statements for investors.
Healthcare:
- AI Dashboards: Forecast patient admissions, flag potential equipment failures, and identify population health trends using machine learning.
- BI Tools: Create compliance dashboards for regulatory audits, monitor historical patient outcomes, and track the financial performance of departments.
Education:
- AI Dashboards: Spot at-risk students early by analyzing attendance, grades, and behavioral data. Recommend personalized learning paths.
- BI Tools: Provide enrollment trend analysis, graduation rates, and funding utilization reports.
Catch-point: In each case, AI dashboards excel at real-time, forward-looking actions, while BI tools remain critical for structured, historical understanding.
Core Features of Artificial Intelligence Dashboards vs Business Intelligence Tools
AI Dashboard Features:
- Predictive Modeling: Uses machine learning to forecast outcomes (e.g., sales, patient load).
- Prescriptive Recommendations: Suggests next steps based on data patterns.
- Natural Language Query: Allows users to ask questions conversationally.
- Automated Alerts: Notifies users of anomalies or opportunities.
- Adaptive Learning: Improves accuracy over time as models are retrained.
- Real-Time Data Processing: Enables instant insights from live data streams, and when paired with an AI agent dashboard, can immediately trigger next steps such as sending alerts or initiating automated actions.
BI Tool Features:
- ETL and Data Cleansing: Ensures data accuracy and reliability.
- Custom Reporting: Supports deep-dive analysis and customizable dashboards.
- Interactive Visualization: Provides drill-down capabilities for exploration.
- Governance: Role-based access control and audit trails.
About 75% of businesses now rely on cloud-based BI solutions.
Comparison: AI dashboards redefine decision-making by suggesting actions, whereas BI tools provide the data context for those actions. Together, they close the loop from insight to execution.
Use Cases for Entrepreneurs, Solopreneurs & Healthcare
For Entrepreneurs & Solopreneurs:
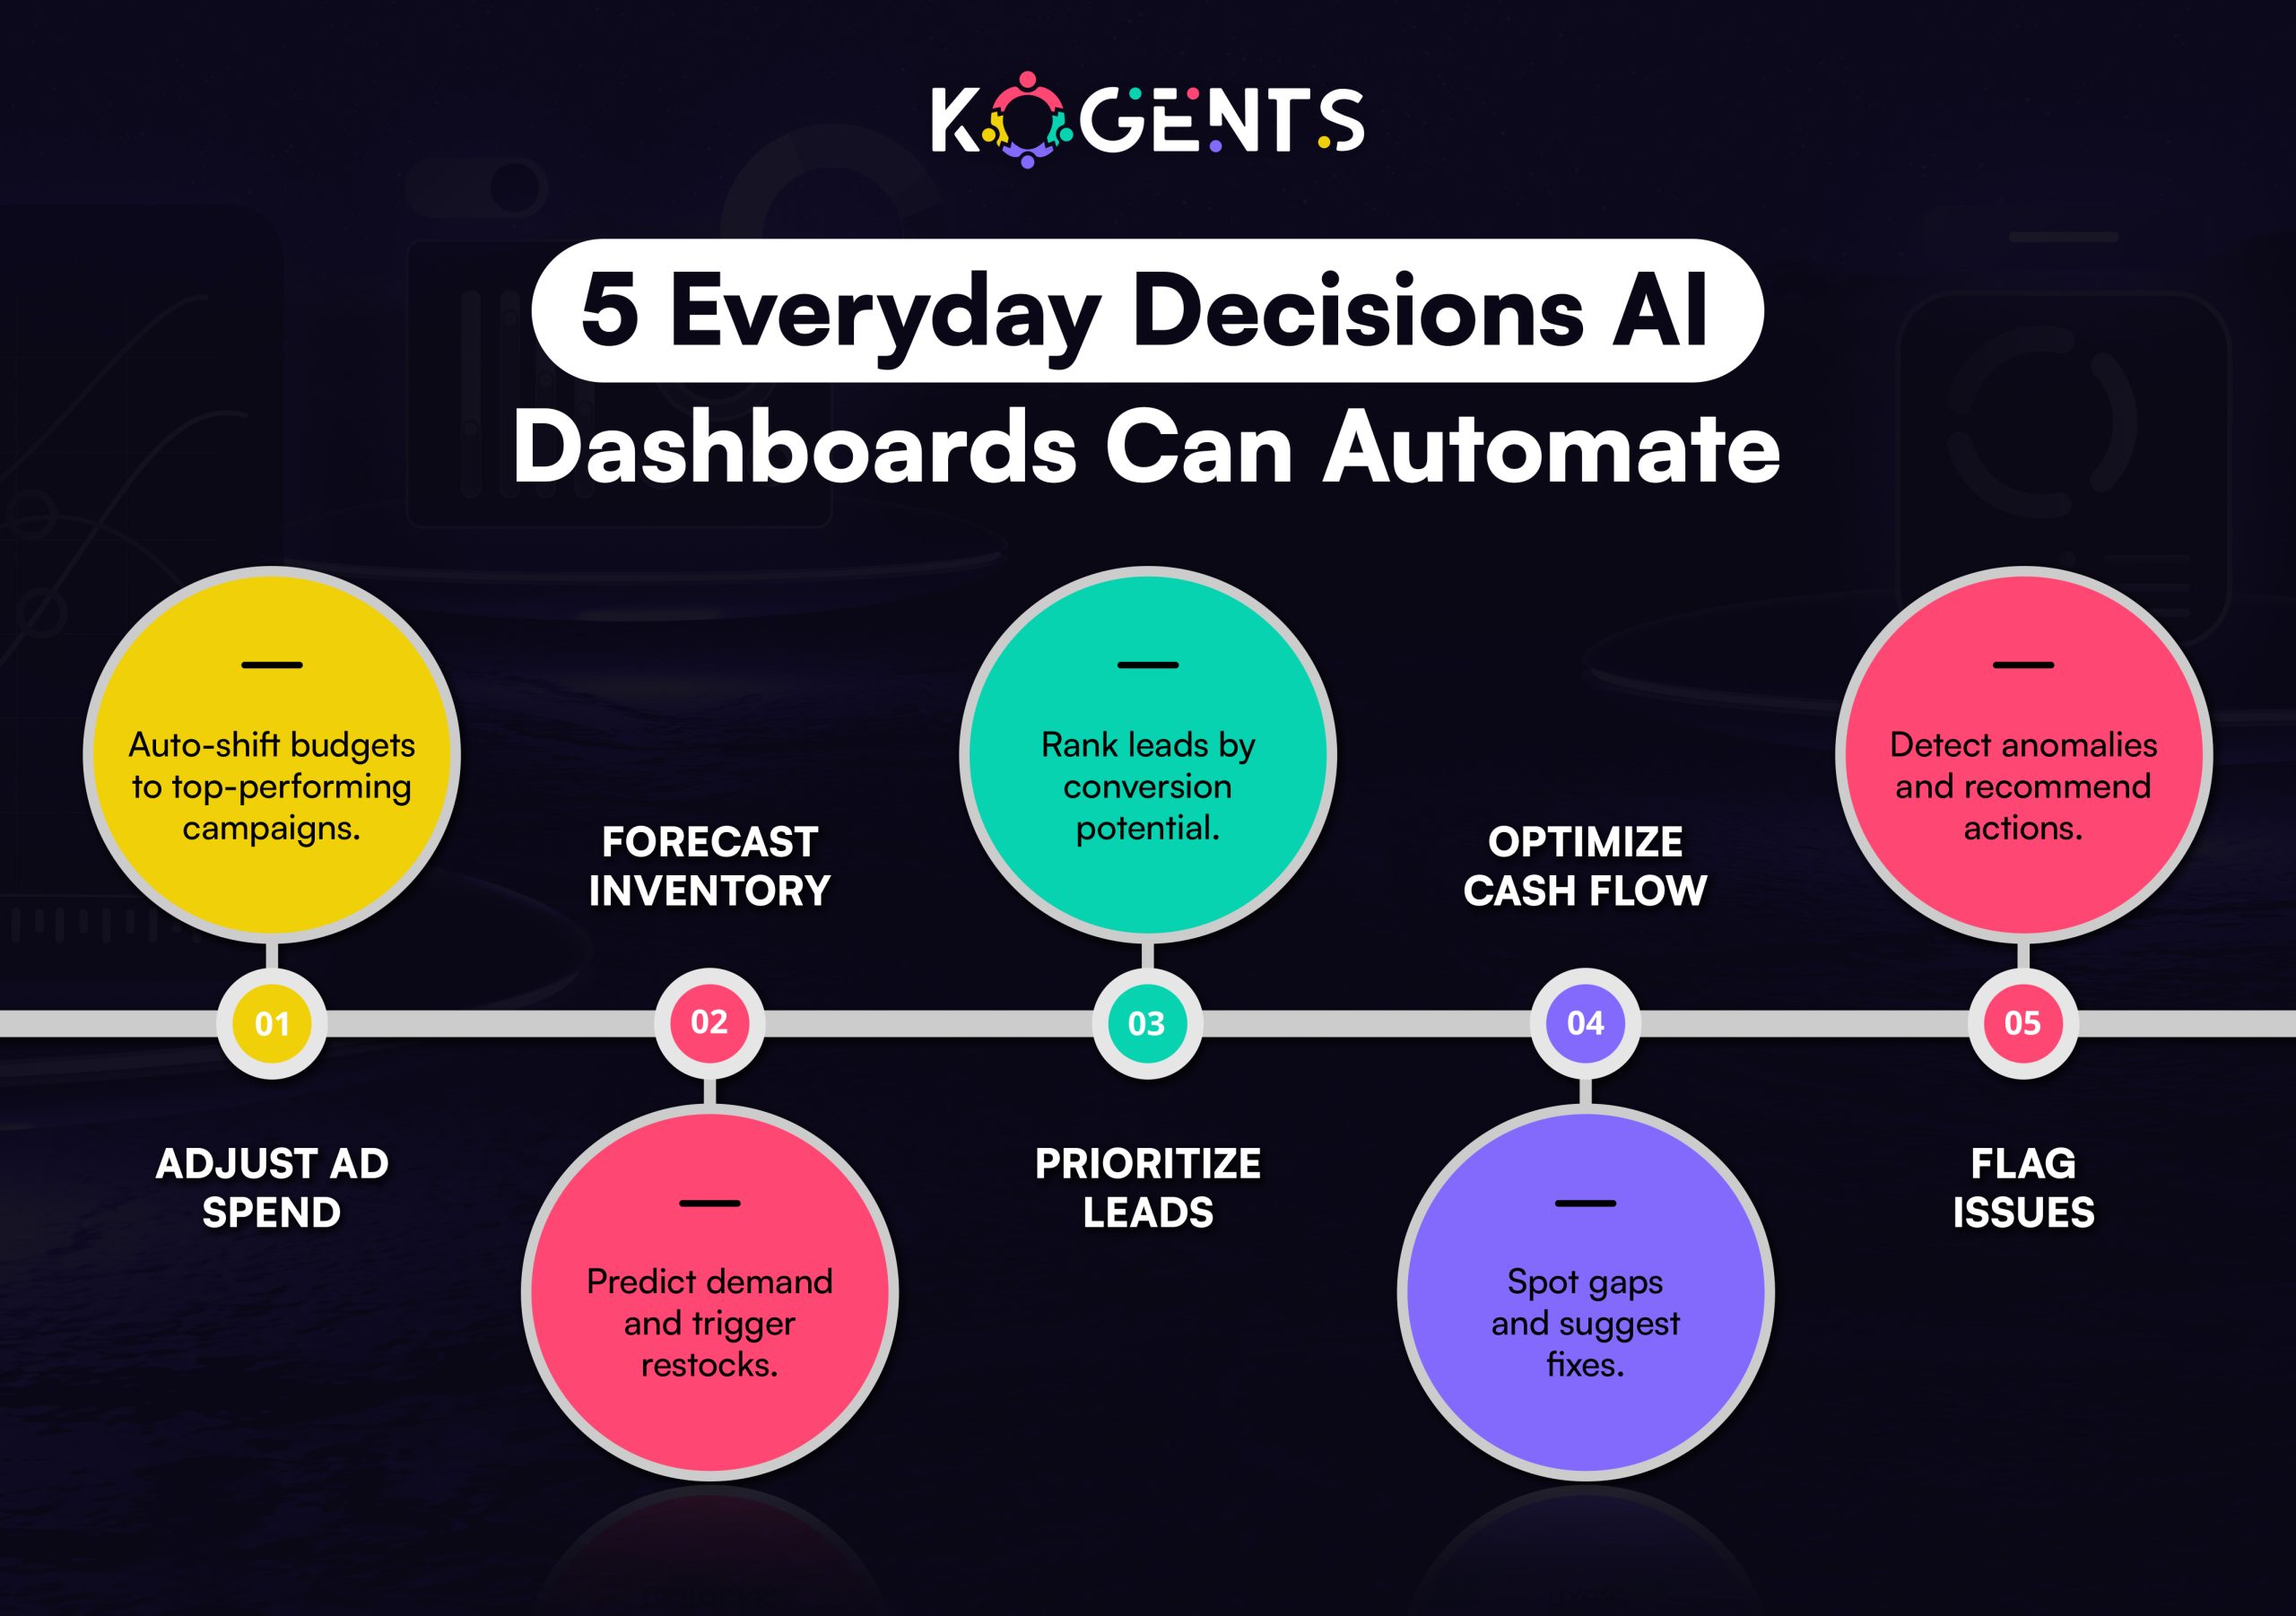
- Marketing Analytics: AI dashboards for marketing analytics can identify which campaigns drive the highest ROI and recommend budget shifts.
- Sales Forecasting: AI dashboards for sales performance can help founders prioritize leads based on conversion probability.
- Operations Monitoring: A dashboard with AI insights can monitor supply chain metrics and alert when inventory is low.
For Healthcare Providers:
- Predictive Patient Care: AI dashboards can forecast admission surges, enabling better resource planning.
- Clinical Quality Tracking: Real-time monitoring of key health outcomes can improve compliance.
- Mental Health Support: AI-driven dashboards can track therapy session attendance and flag risks for early intervention.
Benefits of Artificial Intelligence Dashboards vs Business Intelligence Tools
- Enhanced Agility: Respond to market changes in real time.
- Data-Driven Culture: Empower every team member to make informed decisions.
- Improved Forecast Accuracy: Use predictive modeling to plan with confidence.
- Competitive Advantage: Spot opportunities earlier than competitors.
- Time Savings: Automate routine analysis and reporting tasks.
Key Highlight: When combined with BI tools, these benefits expand to cover both operational oversight and strategic forecasting, giving entrepreneurs and solopreneurs an edge.
Challenges & Limitations of Artificial Intelligence Dashboards vs Business Intelligence Tools
- Model Bias: Poorly trained models can lead to skewed recommendations.
- Complex Implementation: Integrating data pipelines can be resource-intensive.
- Cost Barrier: High-quality AI dashboard software may be priced out of reach for early-stage startups.
- Data Security: Sensitive healthcare or education data requires strong compliance protocols.
- Adoption Hurdles: Employees may resist trusting AI-generated insights until they see consistent accuracy.
Key Note: These challenges highlight the importance of pairing AI dashboards with solid BI infrastructure and data governance practices.
Artificial Intelligence Dashboards vs Business Intelligence Tools vs Other Tools
| Feature/Aspect | AI Dashboard | Business Intelligence Tool | Other Tools (Spreadsheets, Static Reports) |
| Focus | Predictive & prescriptive insights | Descriptive analytics | Raw data & manual analysis |
| Automation | High (automated recommendations) | Medium (manual analysis needed) | Low |
| Interactivity | Conversational (NLQ) & adaptive | Interactive filters & drilldowns | Static |
| Data Freshness | Real-time or near real-time | Periodic refresh | Manual updates |
| Complexity | AI/ML-driven | Data modeling & visualization | Minimal |
| Best For | Entrepreneurs seeking growth insights, healthcare forecasting, and proactive decisions | Structured historical analysis, compliance, and reporting | Ad-hoc calculations |
Artificial Intelligence Dashboards vs Business Intelligence Tools: Know The Future!
The future is not about AI dashboards replacing BI tools, but about convergence. Expect to see:
- Unified Platforms: BI tools with built-in predictive modeling and embedded AI dashboards in BI.
- Explainable AI: Greater transparency into how predictions are made.
- Conversational Interfaces: More intuitive voice and chat-based analytics.
- Autonomous Decision Support: Systems that not only recommend but also automate actions.
- Sector-Specific Solutions: Tailored AI dashboards for healthcare, education, and small business growth.
| What You Need to Know? As these technologies mature, businesses, clinics, and schools will experience a paradigm shift toward data-driven, automated decision-making. |
Case Study 1: Startup Scaling with an AI Dashboard
A SaaS startup implemented an AI business dashboard integrated with HubSpot and Stripe. Within 3 months, they:
- Reduced churn by 18% using predictive models.
- Increased MRR forecasting accuracy by 25%.
- Saved 12 hours per week on manual reporting.
Case Study 2: Clinic Improving Outcomes
A mental health clinic used an AI analytics dashboard to monitor therapist workloads and patient wait times. The system predicted no-show probabilities and sent reminders, reducing no-shows by 30%.
Closing Remarks!
For entrepreneurs and solopreneurs, the question isn’t whether to choose between AI dashboards and BI tools; it’s how to leverage both strategically.
Artificial intelligence dashboards offer agility, predictive insight, and automation, making them ideal for fast-moving businesses.
BI tools provide structured analysis, governance, and historical context, ensuring decisions are grounded in reliable data.
Businesses that embrace this dual approach are future-proofing their operations.
Entrepreneurs gain clarity and speed, solopreneurs reclaim precious time, and healthcare providers improve outcomes.
The future belongs to those who not only see what has happened but act confidently on what will happen next.
Kogents.ai empowers you to do exactly that, turning raw data into actionable intelligence and helping you stay ahead in an increasingly competitive landscape.
So, drop an email at info@kogents.ai or give us a call at (267) 248-9454.
FAQs
What is an artificial intelligence dashboard?
An AI dashboard is an intelligent dashboard that uses machine learning to provide predictive insights, recommendations, and real-time alerts.
How does an AI dashboard work?
It connects to your data sources, applies AI/ML models, and visualizes insights through interactive charts and natural language interfaces.
AI dashboard vs BI dashboard: What’s the difference?
BI dashboards show historical data; AI dashboards predict trends and recommend actions.
What are the best AI dashboard tools for 2025?
Tools like Tableau (with AI features), Power BI, Databricks, and Polymer offer strong AI integrations.
Can I use an AI dashboard for marketing analytics?
Yes, you can track campaign ROI, recommend budget shifts, and forecast customer acquisition.
What are the risks of AI dashboards?
Bias, data privacy issues, and explainability are key concerns.
Are there free AI dashboard tools?
Yes, some platforms offer free tiers, but enterprise-grade features may require paid plans.
How do AI dashboards integrate with BI tools?
They can embed directly within BI platforms or work as standalone predictive layers.
What industries benefit most from AI dashboards?
Retail, healthcare, education, SaaS, and financial services benefit the most.
What are AI dashboard design best practices?
Keep it simple, prioritize real-time data, use NLQ for accessibility, and ensure explainability for trust.
Kogents AI builds intelligent agents for healthcare, education, and enterprises, delivering secure, scalable solutions that streamline workflows and boost efficiency.